Benefit Inflation Chart 1981-2020
BenefitsAdvice :: MAIN FORUM :: LOUNGE
Page 1 of 1
![]()
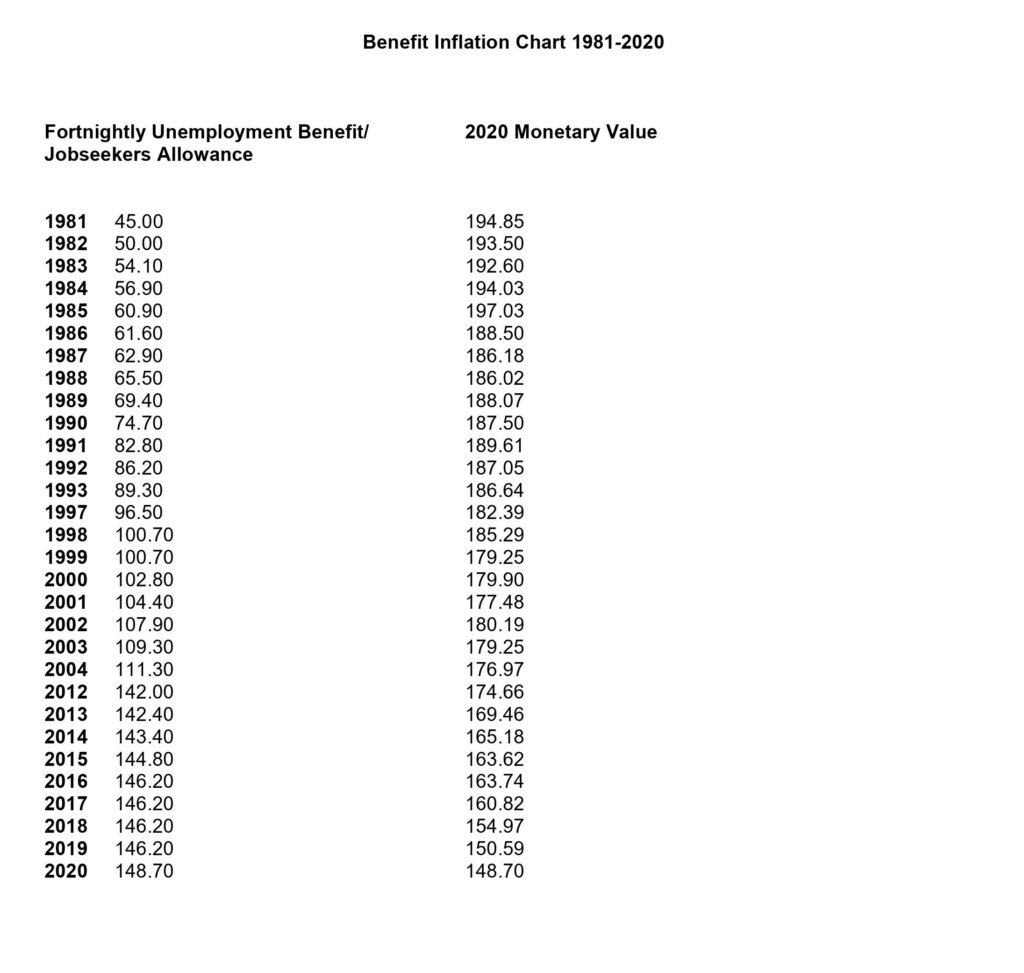
 Benefit Inflation Chart 1981-2020
![]() by Archangel Wed Jan 19, 2022 1:43 pm
by Archangel Wed Jan 19, 2022 1:43 pm
This chart shows you how benefit amounts have devalued since 1981.
Archangel- Posts : 419
Points : 641
Reputation : 6
Join date : 2019-11-15
Caker and Pintel like this post
![]()
![]()
![]()
» april 2020 benefit rates
» 16 Universal Credit and benefit changes announced in Budget 2020
» DWP benefit and pension rates for April 2020 officially set by MPs - full list
» Universal Credit 2020 pay rise call as staggering impact of benefit cuts revealed
» Universal Credit: Number of people on new benefit will DOUBLE this year
BenefitsAdvice :: MAIN FORUM :: LOUNGE
Page 1 of 1
Permissions in this forum:
You cannot reply to topics in this forum